Descripion
The name of my Trading System is Intraday Trend Following Trading System. It is a complete High Probability Trading System where you will find entry rules and exit rules. This system is applicable for Scalpers and also Day Trader.
The required indicators to use this system are provided here . You can use the template given there which will save your time to setup indicators but keep an clean chart beside to draw trendline and major support & resistance by yourself . I have provided some valuable books also for traders in the Home page .
You must have to use multiple timeframe to detect an high probility trading opportunity. For my trading sytem I have chosen H4 as High timeframe, H1 as Intermediate timeframe and M30 as Small timeframe. You have to detect the current trend bias using high timeframe , then read context and read stochastic in the intermediate timeframe . If same bias in Intermediate timeframe then go for small timeframe to execute the high probability trade with perfect entry. Also you can use smaller timeframe like M5 to have the forecast that the setup materializes.
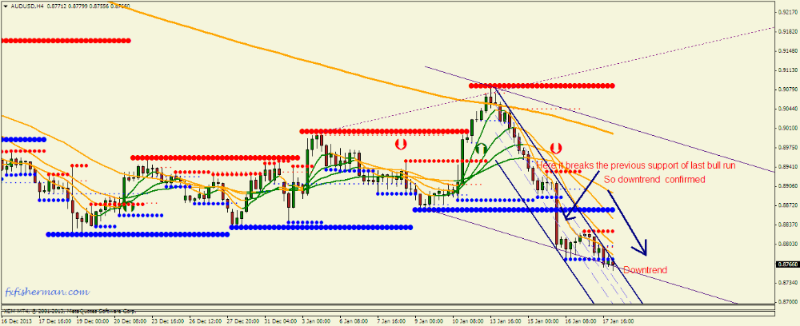
From the image above, it is clear that AUD/USD H4 is in down Trend.Price is below all the moving averages. So the bias is short bias. So we look for short at this moment. Taking any long will be low probability trade. We have used here 8,18, 30, 60 120 lwma as filter to understand trend. As I have mentioned earlier and again want to mention no long trade is allowed is a short bias and short trade allowed in a long bias. As the bias is short we will look for short now. I have used Slide channel indicator here which has automatically drawn the channels. Try to draw trendline by your self in a naked chart beside. Also try to draw the major resistance and support by yourself.
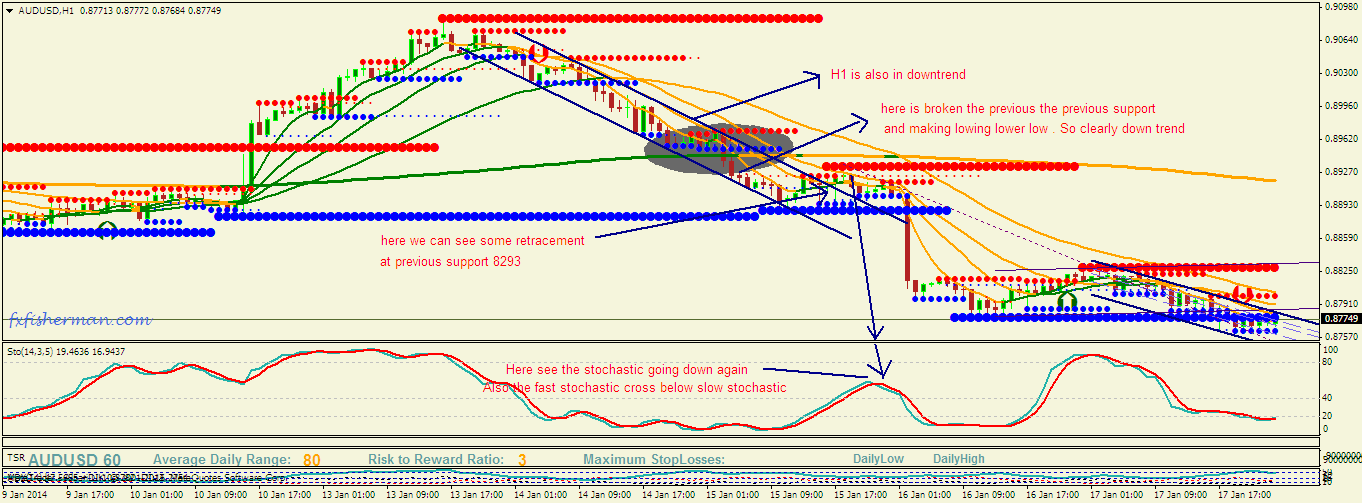
Now come to the intermediate H1 timeframe. Look at the strength of the currency and also the strength of the dollar in the currency strength indicator given. Also look at the stochastic to observe momentum.
In the picture above H1 is also in downtrend . We can see some retracement at the previous support 0.8886 which was the support of previous bull run. So we will wait for the end of retracement and breaking of the support level to have confirmation of downtrend. When a support broken it becomes resistance and vice versa. So we have to wait to support become resistance. We can see the retracement get resistance by the broken support above. Now again started downtrend. Also the stochastic indicating downtrend gets momentum. Now if the support .8886 broken then placing a short is a high probability trade .
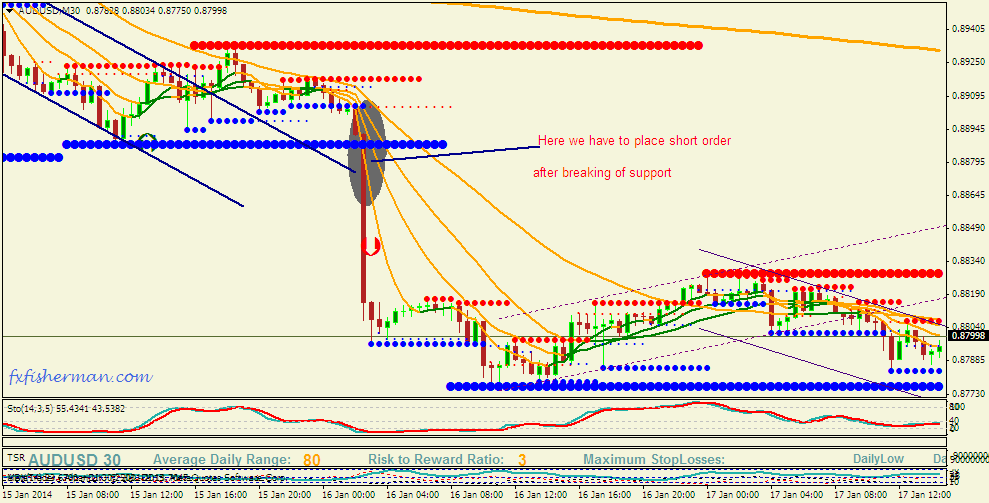
Now we will go to short timeframe m30 for the better entry.
So we have to execute the high probability trade with better entry using small timeframe m30.
To make a short bias high probability trade you have to be confirmed that lwma 8 already crosses down lwma 30 in M30 tf . Also price must have to be full bar closed below lwma 18. Also see the price to full bar close below lwma 18 in tick chart or M5 tf before making an entry.
To make a long bias high probability trade you have to be confirmed that lwma 8 crosses up already lwma 30 in M30 tf . Also price must have to be full bar closed above lwma 18. Also see the price to full bar close above lwma 18 in tick chart or M5 tf before making an entry.
Step by step Procedure :
1. Determine the current bias using H4 tf. Draw trendline and major support and resistance using H4.
2. Read indicator using H1 tf , wait for H1 to come in same bias .
3. Read M30 tf before making entry.
Entry rules:
Long Bias:
Wait for the price close with full bar above lwma 18 in M30 and M5 tf . Also be confirmed that lwma 8 already crosses up lwma 30.
Short Bias:
Wait for the price close with full bar above lwma 18 in M30 and M5 tf . Also be confirmed that lwma 8 already crosses up lwma 30.
Exit rules:
Long Bias:
If previous support breaks down and price goes down below lwma 8 in M30 tf.
Short Bias:
If previous resistance breaks up and price goes above lwma 8 in M30 tf.